In recent elections, Black voters have represented one of the strongest voting blocs for Democratic presidential candidates. Although former President Barack Obama drew unusually high support among Black voters in both 2008 (95%) and 2012 (93%), support among Black voters was still consistently high for Democratic candidates Al Gore (90%), John Kerry (88%), and Hillary Clinton (89%).[1] However, Black voters’ support for President Joe Biden dropped to 87% in 2020 and recent polls show that former President Donald Trump may be making further inroads with some segments of African American voters.
This Spotlight Analysis takes a closer look at the partisan affiliations of Black Americans today and the relationship between Black Americans’ religious affiliation and partisanship. Finally, we consider how Black Americans view the two likely presidential nominees, President Joe Biden and former President Donald Trump, by religion, age, gender, and education levels. We find that few Black Americans hold favorable views of Trump compared with Biden, but Biden’s support among younger Black Americans and those who are religiously unaffiliated is less secure.
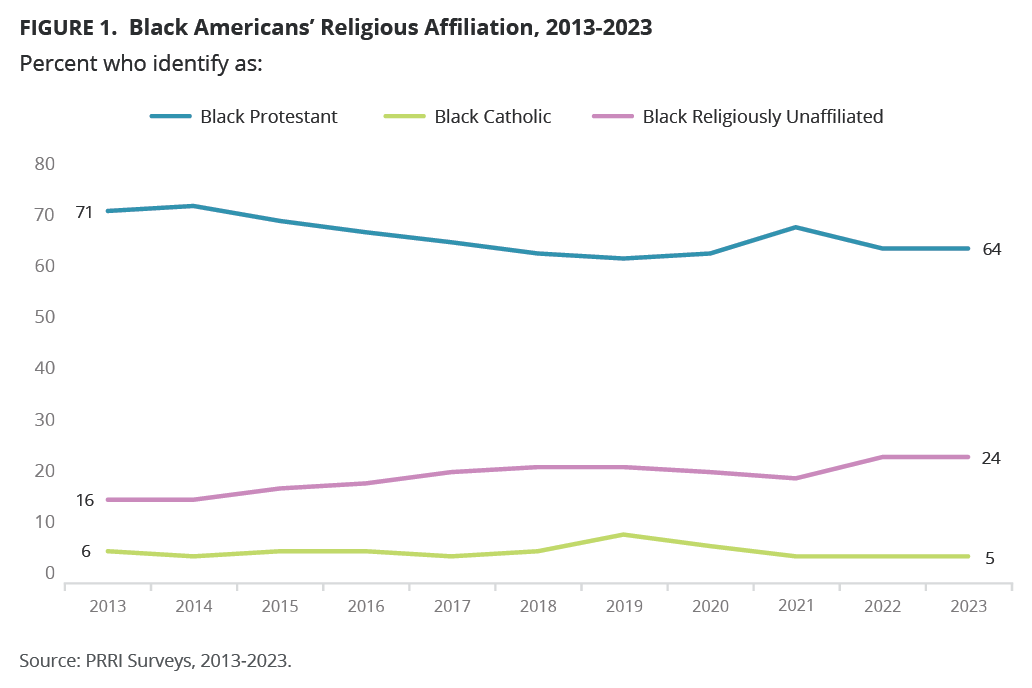
Religious Affiliation Among Black Americans from 2013 to 2023
As of 2023, nearly two-thirds of African Americans identify as Protestant (64%) and 5% identify as Catholic. Yet, though religion continues to be important to many Black Americans, the percentage of Black Americans who identify as religiously unaffiliated has grown eight percentage points over the last decade, from 16% in 2013 to 24% in 2023. The percentage of Black Americans who identify as Protestants has decreased from 71% in 2013 to 64% in 2023, while the percentage of Black Catholics has remained consistent during this time frame.[2]
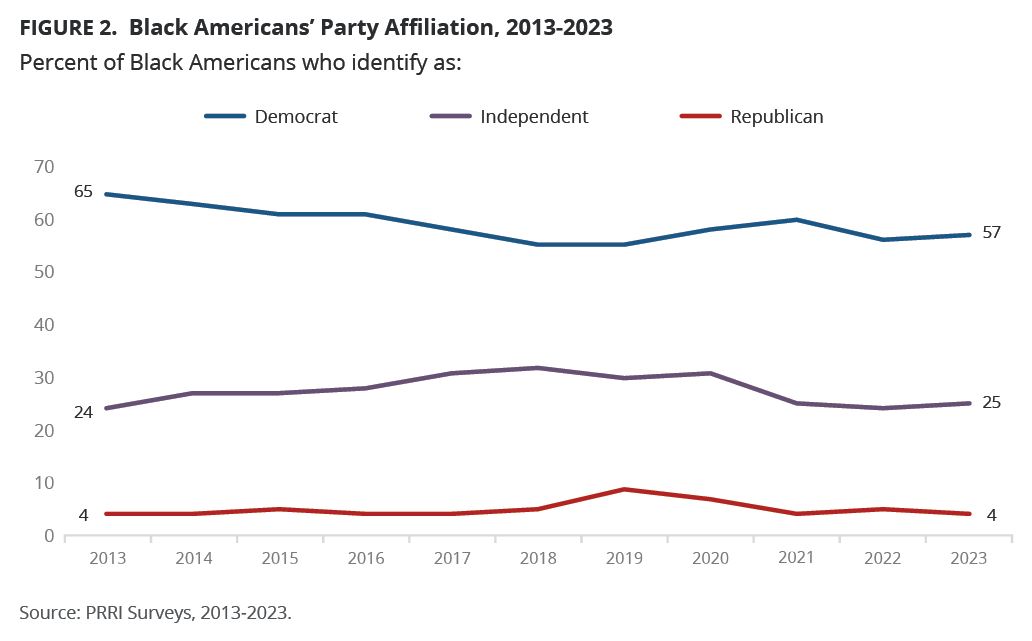
Party Affiliation Among Black Americans from 2013 to 2023
In the last decade, the percentage of Black Americans who identify as Democrats has decreased about eight percentage points (from 65% in 2013 to 57% in 2023), while the percentage of Black Americans who identify as Republican and independent has remained consistent. One-quarter of Black Americans identify as politically independent (25%) and just 4% identify as Republicans.[3]
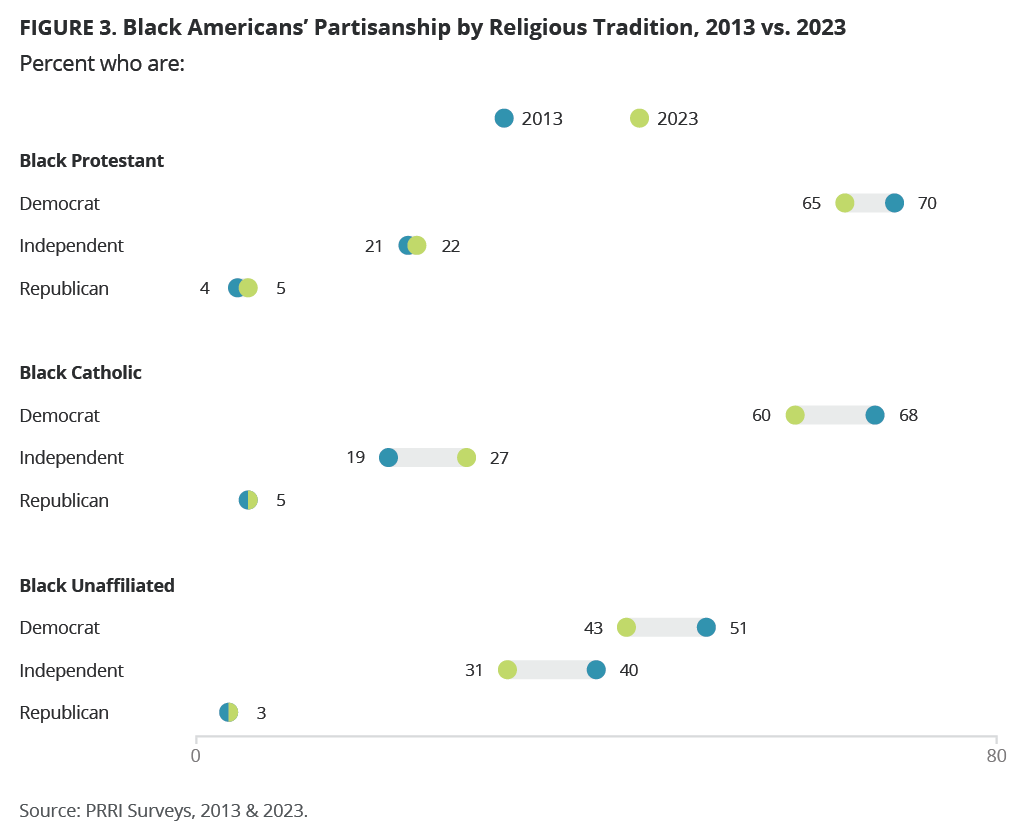
As of 2023, around two-thirds of Black Protestants (65%) identify as Democrats, a decline from a high of 70% in 2013. By contrast, 22% of Black Protestants identify as independents and just 5% as Republicans.
Black Catholics who identify as Democrats have also declined over the past decade from 68% to 60% today. By contrast, Black Catholics who identify as independent increased from a low of 19% in 2013 to 27% in 2023. Five percent of Black Catholics identify as Republican.
Notably, religiously unaffiliated Black Americans are less likely to identify as either Democrats or Republicans than their Christian counterparts. The share of Black unaffiliated Americans who identify as Democrats declined from 51% in 2013 to 43% in 2023 while the percentage of Black unaffiliated Americans who identify as independent decreased from 40% in 2013 to 31% in 2023. Just 3% identify as Republican.
2024 Presidential Candidate Favorability Among Black Voters
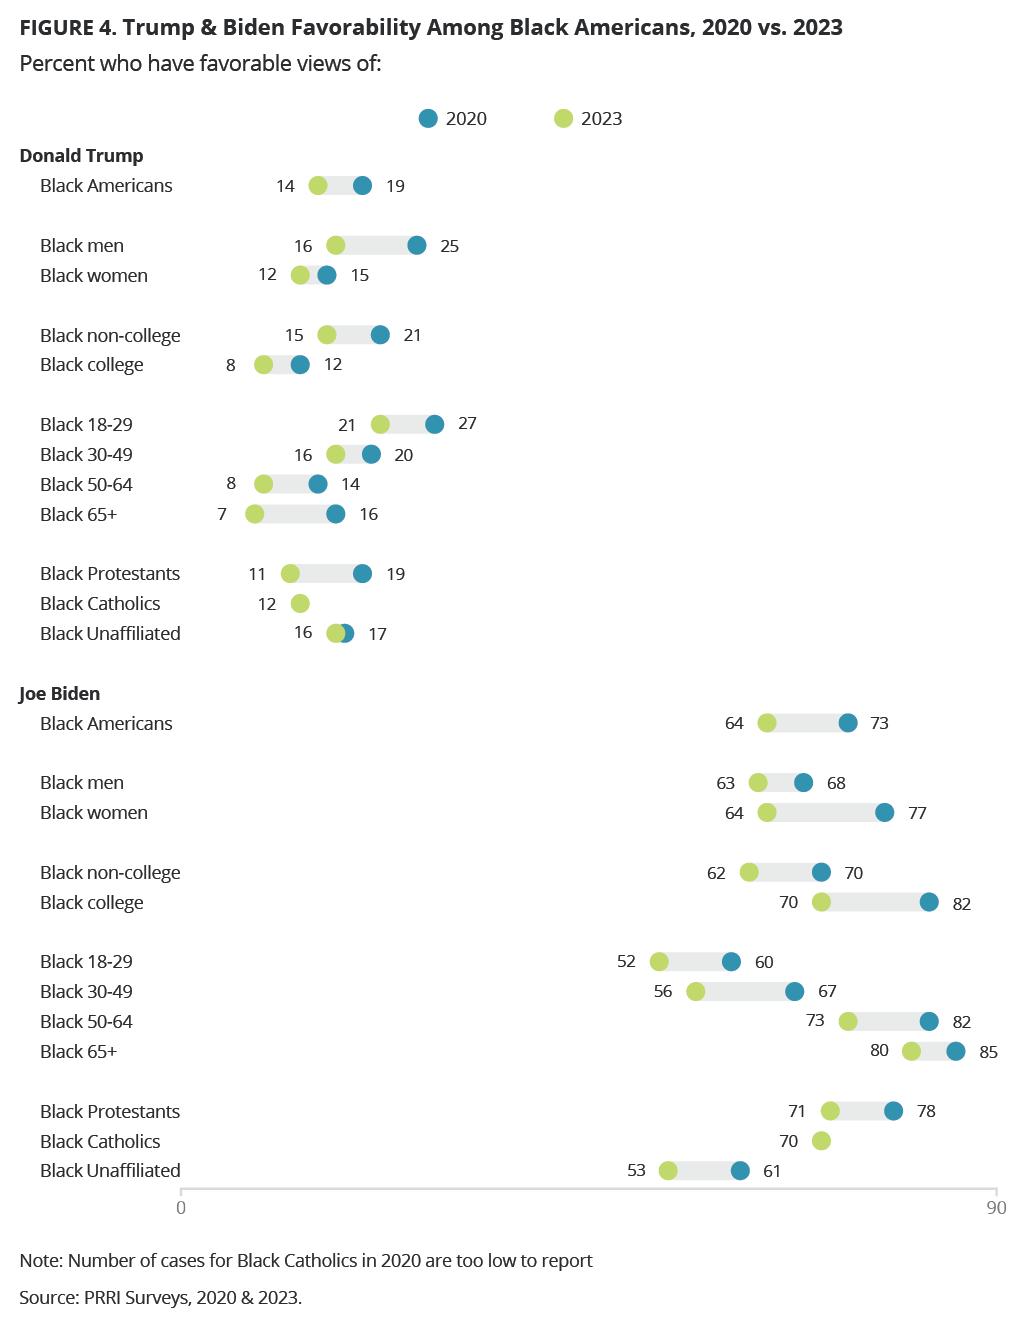
Donald Trump
Support for former President Donald Trump has remained consistently low among Black Americans and declined over the past three years (from 19% in 2020 to 14% in 2023). Black men are slightly more likely than Black women to show favorable views of Trump in 2023 (16% among Black men vs. 12% among Black women). This gap was wider in 2020 (25% vs. 15%).
While favorable views of Trump among Black Americans without a college degree slightly decreased from 21% in 2020 to 15% in 2023, there was no meaningful change among Black Americans with a college degree over the same time frame (12% in 2020 and 8% in 2023).
Trump’s favorability among Black Americans has not changed significantly in the past three years across age groups, except among senior Black Americans. Today, Black Americans who hold favorable views of Trump account for 21% of Black Americans ages 18-29, 16% of those ages 30-49, and 8% among those ages 50-64. Favorable views of Trump among Black Americans 65 and over dropped from 16% in 2020 to 7% in 2023. Finally, support for Trump is very low among unaffiliated and Black Christians. Roughly one in ten Black Protestants (11%) and Black Catholics (12%) hold favorable views of Trump; among Black religiously unaffiliated Americans, 16% hold favorable views of Trump.
Joe Biden
Black Americans’ support for President Joe Biden has declined from 73% in 2020 to 64% in 2023, among both men and women. However, this decline is particularly evident among Black women (from 77% to 64%), compared with Black men (from 68% to 63%).
Even though majorities of Black Americans with and without a college degree hold favorable views of Biden, there has been a significant decline over the past three years among Black Americans with a college degree (from 82% in 2020 to 70% in 2023). Biden’s favorability among Black Americans without a college degree also dropped during that time from 70% to 62%.
Younger Black Americans are significantly less likely to support Biden than older Black Americans: 52% of Black Americans ages 18-29 and 56% of those ages 30-49 versus 73% of those ages 50-64 and 80% of those 65 and older. Favorable views of Biden dropped significantly from 2020 to 2023 among Black Americans 30-49 (from 67% to 56%) and among those 50-64 (from 82% to 73%).
Religiously unaffiliated Black Americans are notably less likely to hold favorable views of Biden compared with their Christian counterparts. As of 2023, a slim majority of Black unaffiliated Americans (53%) hold favorable views of Biden, a decline of eight percentage points from 61% in 2020. By contrast, about seven in ten Black Protestants (71%) and Black Catholics (70%) hold favorable views of Biden as of 2023, but Black Protestants’ favorability also dropped from 78% in 2020.[4]
[1] Black Voter Project. 2020. “Blacks for Trump: Is Trump ‘Pulling’ Black Votes, or Are We Just Returning to Politics as Usual?” October 16, 2020. https://blackvoterproject.com/news/2020/10/16/blacks-for-trump
[2] The remaining 7% of Black Americans identify as Jehovah’ Witnesses (2%), Muslims (2%), other non-Christians (2%), or Latter-Day Saints (1%).
[3] The majority of Black Americans identify as Democrat, independent, or Republican, but a smaller percentage identify with other party or refused to answer. This percentage has doubled over the past decade from 7% in 2013 to 14% in 2023.
[4] The sample size for Black Catholics in 2020 is too small to report.